CxSAST Quick Start (v8.9.0 and up)
This Quick Start includes information on setting up first project scans and an overview of presets.
Setting Up
In the Projects & Scans > Create New Project window perform the following procedure:
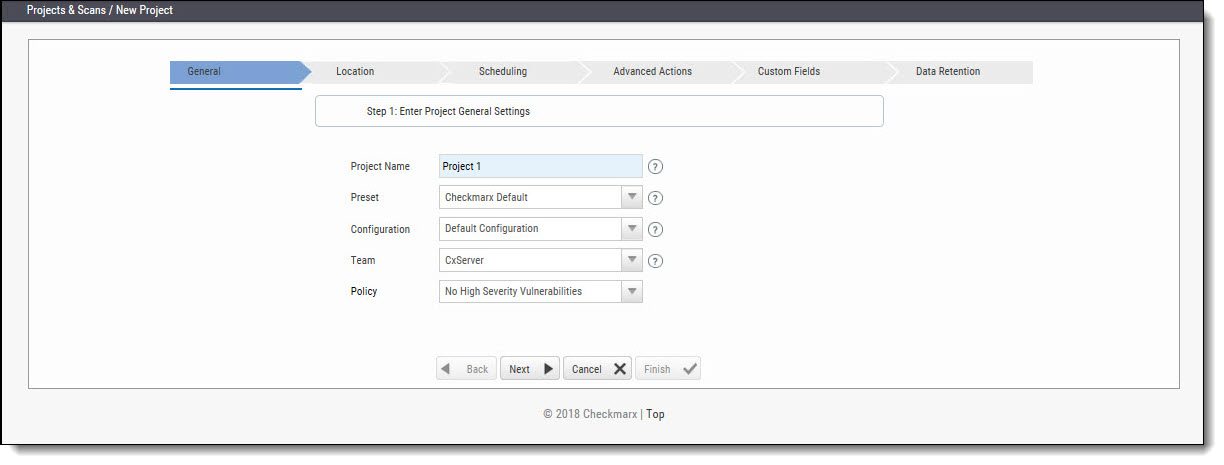
Step 1: Enter Project General Settings
Project Name: Provide an appropriate Project Name for the project.
Preset: The Preset will determine the scan rules for the project. Select the appropriate scanning Preset from the drop-down list.
Configuration: Select the Configuration for the new project. For the trial version, it is advised to perform the default selection.
Team: Select the Team for the new project. For the trial version, it is advised to perform the default selection.
- Policy: Select a policy for the project. For the trial version, it is advised to select from the default selection.
It is advised to leave the fields Configuration and Team unchanged in the trial.
Step 2: Select Source To Scan
- Select Local to upload code as a ZIP file. The code must be zipped by MS zip. The test account is limited to 350,000 Lines of Code (LOC).
- Select Shared, Source Control or Source Pulling, and upload the code in any other format.

Note that you can scan the "OWASP Benchmark Project" code; go to https://github.com/OWASP/benchmark, click the Clone or download button and select your preferred option.
3. Other sample code for scanning include:
Bookstore.Net; Bookstore.Java; Bookstore.php4; WebGoat5.0; WebGoat6.0; CPP Example; iGoat; Samples; Android.
4. If using a Browser/ Eclipse/ Visual Studio/ IBM RAD, please start with the browser option.
5. When the Finish button becomes active, click Finish to place the project into a queue.
Step 3: Scan Execution
- In Projects & Scans > Queue, monitor the scan progress by clicking the project line in the queue table.

Reviewing Scan Results
Step 1 – Projects & Scans
- In Projects & Scans > Projects, click Scans List to view the high level summary of scan results and account activity.

For more information on Dashboards click.
Step 2 – Review Scan Results in the Source Code
View detailed scan results within the Source Code. Vulnerabilities and navigated attack path are highlighted.
The View Results page is divided into four (4) sections:
- Scan Results Summary by vulnerability,
- Results table or Graph,
- Attack Vector
- Source code
Scan Result Summary
- Scan Results Summary pane: Summary of vulnerabilities detected, grouped by High, Medium and Low titles. The summary shows the number of instances of those vulnerability appearances in the code. The “tool tip” displays more information about the specific vulnerability and best practice technique for removal.

- Source Code pane: View specific points of vulnerabilities detected within the Source Code.

- Results Table: A listing of each vulnerability instance and detail. Manage results by using the Filter button to organizes data and saves results.
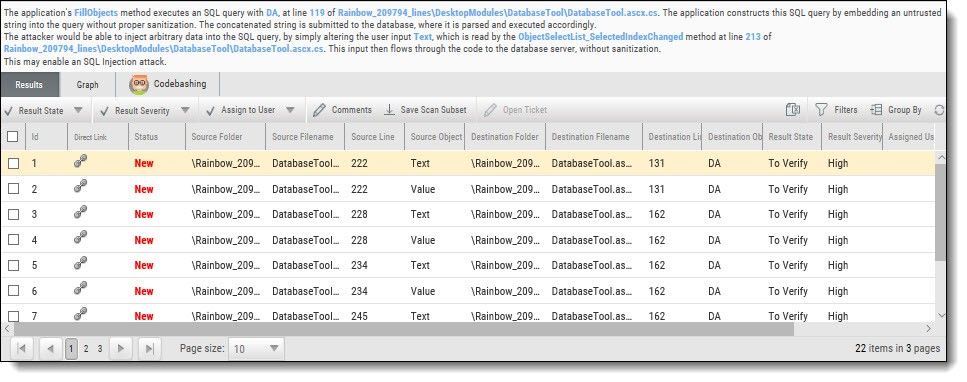
- Graph: Gain a macro chart perspective vulnerabilities found in code, see correlations and identify the optimal points for fix (red buttons).

- Attack Vector: Note the full path of code elements that constitute the vulnerability instance selected in the Results pane.

For more information on Working with Scan Results, click.
Preset Manager: Overview
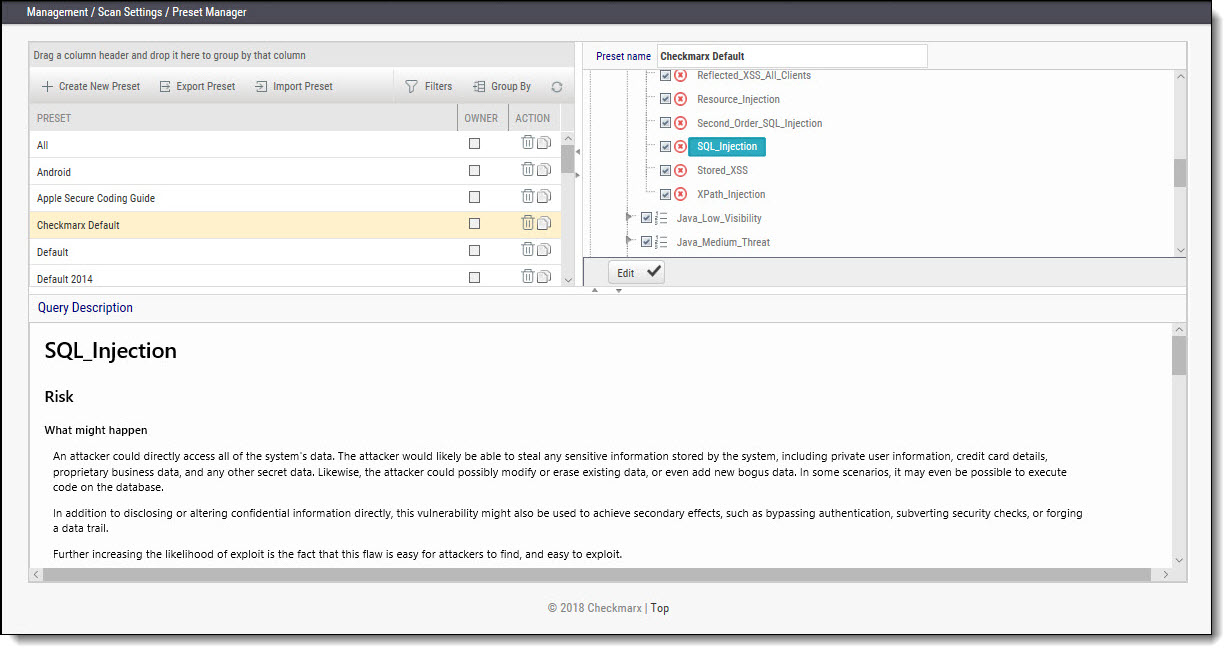
A Preset Setting consists of a group of queries. The Preset Manager enables the viewing of query details in each Preset.
To access the Preset Manager go to Management > Scan Settings > Preset Manager.
Queries contained inside the preset are presented in the right pane and description of vulnerability discovered by each query are described in Query Description below.
For more information on Managing Presets click.